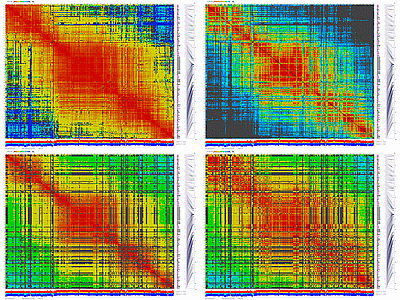

Visualization of marker raw scores for Arabidopsis genetic map, chromosome 4:

To generate the image above run py_matrix_2D_V112_RECBIT.py
script with following options:
python py_matrix_2D_V112_RECBIT.py DL_RIL_Data.may2001.out.pairs_all ath-chrom4-map.txt ath-chrom4-map.out.pymapx Dean_Lister_frame.IDs Y DL_RIL_Data.may2001.loc REC 0 0.9
(similar to py_matrix_2D_V087_RECBIT.py usage with exception of the last two additional arguments: 0 and 0.9)
upon execution several images will be generated:
ath-chrom4-map.out.pymapx.large.png - large image (full size image)
ath-chrom4-map.out.pymapx.medium.png - medium size image (1000 x 750 pixels)
ath-chrom4-map.out.pymapx.small.png - small image (200 x 150 pixels)
ath-chrom4-map.out.pymapx.2000.png - image with size 2000 x 1500 pixels (optional)
ath-chrom4-map.out.pymapx.tab - 2D matrix text file
(no difference from py_matrix_2D_V087_RECBIT.py output)
and four new files:
ath-chrom4-map.out.pymapx.xrecomb.png - image with raw scores (the same as above)
ath-chrom4-map.out.pymapx.xsparse.matrix - matrix file with linkage (1 - recombination_value) values for those pairs of markers where linkage 0.9 or better (it was last argument 0.9 of the script)
ath-chrom4-map.out.pymapx.xgraph.2500.png - really weird representation of linkage group in the form of circular graph
ath-chrom4-map.out.pymapx.xgraph.large.png - the same as above but really huge image
Note, that *.loc (DL_RIL_Data.may2001.loc) file must contain the line with RILs numbering, for example:
; 1 2 3 4 5 6 7 ....
this line is critical for proper script functionality.
you may ignore the understanding of argument 0. It was introduced for debugging purpose.
Example input files can be downloaded here
..................
this is a Arabidopsis genetic map of linkage group 4 in the form of circular graph:

-------------------------------------------------------------------------
Printable Posters:

Download "Arabidopsis Genetic Map" poster 36 x 48 inches: ATH_GeneticMap_B1.ppt (PowerPoint format) images generated with py_matrix_2D_V087_RECBIT.py |

Download "Arabidopsis Five Linkage Groups" poster 36 x 48 inches: ATH_GeneticMap_A1.ppt (PowerPoint format) images generated with py_matrix_2D_V112_RECBIT.py |
email to: akozik@atgc.org Alexander Kozik
last modified November 03 2004