Genetic Map 2D Matrix Plot (CheckMatrix)

by Alexander Kozik, UC Davis, R.Michelmore group


CheckMatrix or py_matrix_2D_VXXX_RECBIT.py gradually evolved into three versions: V087, V112 and V246. All three versions are similar in general. The latest one py_matrix_2D_V248_RECBIT.py has a greater flexibility and functionality. You need to read this web page first regardless of which version you are going to use.
py_matrix_2D_V087_RECBIT.py generates 2D plots of all markers versus all markers displaying recombination scores by color gradient (read this web page for details). Two input files are required: map file and matrix file with recombination scores. Matrix file can be generated using Python_MadMapper_V112_RECBIT.py script. py_matrix_2D_V112_RECBIT.py was extended to generate images with graphical genotyping. Additional file with raw marker scores is required to use this version. Representation of genetic map in a form of circular graph was implemented here. Read more about this version at Genetic_Map_Raw_Scores.html web page (of course, after reading current web page). py_matrix_2D_V248_RECBIT.py has greater flexibility and functionality, color scheme for this version was designed to enhance highlighting of the regions with negative linkage on genetic map. Additional text output files are generated to help to validate constructed genetic maps. Jump to Genetic_Map_Matrix_Plot_Art.html to find details (after reading this web page).

py_matrix_2D_V087_RECBIT.py Python script is designed to visualize and validate genetic maps. py_matrix_2D_V087_RECBIT.py generates 2D plot images of all markers (X axis) versus all markers (Y axis). Each dot on these plots is a recombination/linkage value or other type of scores (LOD, BIT) for any given pair of markers. Markers are ordered as they ordered on genetic maps. Visualization of patterns of colored diagonals on those 2D plots can help to understand and validate constructed genetic maps. Two input files are required. First input file is a genetic map data. Second input file is a "global" matrix file with recombination/linkage data for all possible pairs of markers. Matrix file can be generated by JoinMap program (jmrec), for example, or by accompanying Python_MadMapper_V112_RECBIT.py (PyMap) Python script. Details about usage of Python_MadMapper_V112_RECBIT.py script you can find here. Detailed description of BIT scoring system you can find here. Data for Arabidopsis genetic map based on genotyping of recombinant inbred lines (RILs) developed by Dean and Lister have been used to illustrate usage of py_matrix_2D_V087_RECBIT.py and Python_MadMapper_V112_RECBIT.py scripts. Excel spreadsheet with marker scores and map data have been downloaded from NASC web site. Modified version (can be used by JoinMap) of the file with recombination scores:
            DL_RIL_Data.may2001.loc
and map data for five Arabidopsis chromosomes:
            ath-chrom1-map.txt
            ath-chrom2-map.txt
            ath-chrom3-map.txt
            ath-chrom4-map.txt
            ath-chrom5-map.txt
have been used for further analysis.

Note: to run py_matrix_2D_V087_RECBIT.py script Python interpreter must be installed on your computer (http://www.python.org/) as well as PIL (Python Image Library) from http://www.pythonware.com/

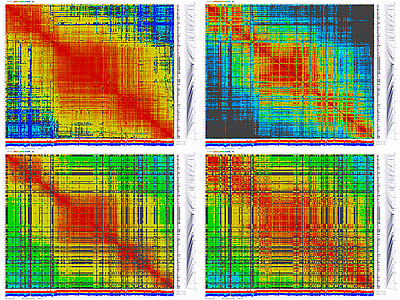
Examples of genetic map 2D plots generated by py_matrix_2D_V087_RECBIT.py script for five Arabidopsis linkage groups. Four different scoring systems (JoinMap recombination, JoinMap LOD, PyMap recombination, PyMap BIT) complement each other in validation of constructed genetic maps. Thumbnail images are web links to the set of full size plots (click on them to view large version of images).

Ath chromosome 1
Ath chromosome 2
Ath chromosome 3
Ath chromosome 4
Ath chromosome 5
JoinMap
recombi-
nation
scores


JoinMap
LOD
scores


PyMap
recombi-
nation
scores


PyMap
BIT
scores


Medium size image of chromosome 4 with explanation [BIT scoring system]:


HOW IT WAS DONE OR
STEP BY STEP INSTRUCTIONS HOW TO GENERATE GENETIC MAP 2D PLOTS


           STEP 1

Generation of "global" matrix file using Python_MadMapper_V112_RECBIT.py script.
Input files: DL_RIL_Data.may2001.loc and optional list of framework markers Dean_Lister_frame.IDs.
Execute from command line:

$python Python_MadMapper_V112_RECBIT.py DL_RIL_Data.may2001.loc DL_RIL_Data.may2001.out 0.2 100 0.25 Dean_Lister_frame.IDs

where:
DL_RIL_Data.may2001.loc - input file,
DL_RIL_Data.may2001.out - output file,
0.2 - recombination value cutoff,
100 - BIT score value cutoff,
0.25 - datapoints value cutoff
Dean_Lister_frame.IDs - framework markers list

With current dataset (1357 markers, 101 RILs) script will work for one or two hours to perform pairwise comparisons between all markers and clustering (1GHz CPU, 2Gb of RAM). Clustering (group analysis) is a final step of this script. Output of the program is a set of 35 files. Detailed description of the output you can find here. To generate 2D matrix plot we are interested in DL_RIL_Data.may2001.out.pairs_all file (53 Mb) only which contains recombination/linkage and BIT scores for all pairs of markers.

[ Alternatively you can use JoinMap output (jmrec) as a global matrix file.
How to work with JoinMap is not a topic of this document ]


           STEP 2

py_matrix_2D_V087_RECBIT.py takes as input matrix file, map file and three optional files: framework markers list, list of IDs to highlight in red and *.loc file with recombination data.

if user provides framework markers list (map of framework markers) then these markers will be painted in purple on 2D plot.
if user provides list of IDs to highlight in red then these markers will be painted in red on 2D plot (we use it to highlight new markers on a map).
if user provides *.loc file with recombination scores (raw data for markers and RILs) then allele composition plot will be generated on the bottom of image.

Program usage:
[matrix_file] [map_file] [output_file] [frame_marker_list] [red_list] [loc_file] [REC/BIT/LOD]
frame_marker_list is optional, if you do not have it just type X
red_list is a list of markers to highlight in red
red_list is optional, if you do not have it just type Y
loc_file is optional, if you do not have it just type Z

For example, for Arabidopsis chromosome 4 we can execute:

$python py_matrix_2D_V087_RECBIT.py DL_RIL_Data.may2001.out.pairs_all ath-chrom4-map.txt ath-chrom4-map.out.bit Dean_Lister_frame.IDs Y DL_RIL_Data.may2001.loc BIT

where:
DL_RIL_Data.may2001.out.pairs_all - matrix file (53 Mb)
ath-chrom4-map.txt - map file
ath-chrom4-map.out.bit - output file(s)
Dean_Lister_frame.IDs - map containing framework markers only
Y - we do not use list of markers to highlight them in red color
DL_RIL_Data.may2001.loc - *.loc file with recombination data
BIT - "BIT" option which tells to program generate image with BIT score

OUTPUT FILES:

Several image files will be generated and one text file:

ath-chrom4-map.out.bit.large.png - large image (full size image)
ath-chrom4-map.out.bit.medium.png - medium size image (1000 x 750 pixels)
ath-chrom4-map.out.bit.small.png - small image (200 x 150 pixels)
ath-chrom4-map.out.bit.2000.png - image with size 2000 x 1500 pixels (optional)
ath-chrom4-map.out.bit.tab - 2D matrix text file


by using REC option (last argument when you run the script) images with recombination scores will be generated:
$python py_matrix_2D_V087_RECBIT.py DL_RIL_Data.may2001.out.pairs_all ath-chrom4-map.txt ath-chrom4-map.out.pymap Dean_Lister_frame.IDs Y DL_RIL_Data.may2001.loc REC

ath-chrom4-map.out.pymap.large.png - large image (full size image)
ath-chrom4-map.out.pymap.medium.png - medium size image (1000 x 750 pixels)
ath-chrom4-map.out.pymap.small.png - small image (200 x 150 pixels)
ath-chrom4-map.out.pymap.2000.png - image with size 2000 x 1500 pixels (optional)
ath-chrom4-map.out.pymap.tab - 2D matrix text file


           STEP 3 (optional luxury)

It is possible to generate genetic matrix 2D plot for the whole Arabidopsis genome. Map data for all five chromosomes were concatenated into one file ath-chrom-all-map.map. ath-chrom-all-map.map file was modified using excel spreadsheet so map positions for markers for all five chromosomes form contiguous sequence: ath-chrom-all-map.mad (check third column).

ath-chrom-all-map.mad file and matrix file DL_RIL_Data.may2001.out.pairs_all have been used as input files for py_matrix_2D_V087_RECBIT.py script:

$python py_matrix_2D_V087_RECBIT.py DL_RIL_Data.may2001.out.pairs_all ath-chrom-all-map.mad ath-chrom-all-map.out.bit Dean_Lister_frame.IDs Y DL_RIL_Data.may2001.loc BIT

Output for the whole Arabidopsis genome:
ath-chrom-all-map.out.bit.large.png - large image (full size image)
ath-chrom-all-map.out.bit.medium.png - medium size image (1000 x 750 pixels)
ath-chrom-all-map.out.bit.small.png - small image (200 x 150 pixels)
ath-chrom-all-map.out.bit.2000.png - image with size 2000 x 1500 pixels

Genetic Matrix 2D Plot for the whole Arabidopsis genome.
Five linkage groups (five chromosomes) are easily distinguishable. Pay attention to the regions with negative linkage (blue areas).


Click here to view a zoomable version of Arabidopsis genetic map (Macromedia Flash plug-in required)


py_matrix_2D_V087_RECBIT.py was written for CGPDB project to assist in construction, validation and visualization of lettuce genetic map. Arabidopsis data were used to check program functionality and compare results with lettuce recombination data.


-------------------------------------------------------------------------

WORK IN PROGRESS!
py_matrix_2D_V112_RECBIT.py version of CheckMatrix besides of all features described above allows visualization of raw marker scores (graphical genotyping) what is also helpful in validation of constructed genetic maps. py_matrix_2D_V112_RECBIT.py displays raw marker scores of RILs as they ordered on a genetic map. Highlighting of all double cross-overs can be helpful to find a set of markers which were probably mis-scored in some cases. Example of visualization of raw scores is shown below:


Detailed description how to use py_matrix_2D_V112_RECBIT.py script (*.loc - locus file is required in this case) can be found here: Genetic_Map_Raw_Scores.html

The latest version py_matrix_2D_V248_RECBIT.py has a greater flexibility, numerous options and improved color scheme. Read more about this version of CheckMatrix here: Genetic_Map_Matrix_Plot_Art.html

-------------------------------------------------------------------------

Printable Posters:


Download "Arabidopsis Genetic Map" poster 36 x 48 inches:
ATH_GeneticMap_B1.ppt (PowerPoint format)
images generated with py_matrix_2D_V087_RECBIT.py

Download "Arabidopsis Five Linkage Groups" poster 36 x 48 inches:
ATH_GeneticMap_A1.ppt (PowerPoint format)
images generated with py_matrix_2D_V112_RECBIT.py

-------------------------------------------------------------------------

email to: akozik@atgc.org Alexander Kozik

last modified February 28 2005